

When a brand says its floss removes up to 55 percent more plaque or contributes to a 50.62 percent reduction in bleeding index, the wording becomes more than marketing. It becomes a promise. In oral care, trust is built on precision. A single percentage point can raise eyebrows among dental professionals who evaluate products through evidence rather than excitement. This is why Smart Floss stands out. The claims are unusually specific and that specificity invites a closer look at the science behind them.
Smart Floss markets itself as a higher performing floss, but performance is not a vague idea. It is something measured through clinical protocols that follow predictable steps. Understanding how those steps work is the only way a dentist, retailer or informed consumer can judge whether a claim is meaningful.
How a Study Is Built
Every clinical product claim rests on a study design.
A good study begins with a defined sample size. Most dental efficacy trials work with 20 to 60 participants. This may sound small, yet well controlled designs allow even modest samples to produce reliable results. Participants are usually randomized into groups. One group uses the test floss. The other uses a standard floss that serves as a control. Randomization ensures that the groups are similar at the start.
There is often some level of blinding. The examiner scoring plaque or bleeding should not know which product the participant used. This protects the results from bias.
Endpoints are chosen before the study begins. For floss, the most common endpoints include plaque index scoring and measures of gingival bleeding. The plaque index is a numerical system that grades how much biofilm remains on different tooth surfaces. Bleeding indices track how gums respond when probed lightly. Reduced bleeding is a reliable marker for better gum health and less inflammation.
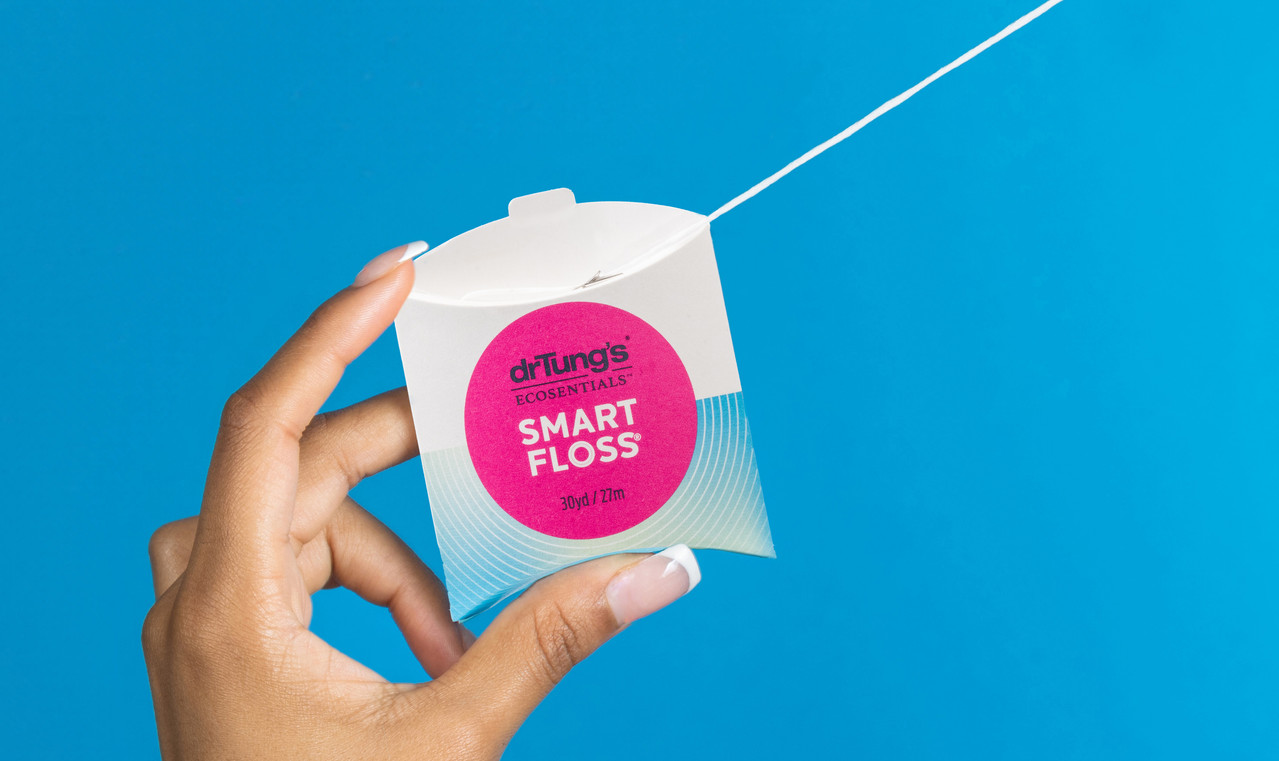
When Smart Floss cites up to 55 percent more plaque removal, it is referring to changes in these standardized scores. When it mentions more than 50 percent improvement in bleeding index, it reflects how gums responded after a set period of use.
What the Numbers Likely Represent
In dental research, both statistical significance and clinical significance matter. Statistical significance tells you whether a result is likely to be due to chance. Clinical significance asks whether the difference actually matters to a real person flossing their teeth every night.
If Smart Floss removed 55 percent more plaque than the control, it does not mean every participant experienced that number. It usually means the test group showed a greater average reduction in plaque index compared to the control group. A difference above 30 percent is often considered noticeable in real world brushing routines. Crossing 50 percent is noteworthy. It suggests that the floss does something mechanically different such as expanding to create more contact with the tooth surface.
A 50.62 percent reduction in bleeding index is also a strong signal. Bleeding is tied to inflammation and inflammation improves when the area is cleaned thoroughly. A reduction above 40 percent is typically considered meaningful in gingival studies. Reaching fifty places the product in a category that will catch a periodontist’s attention.
Who Was Studied and Who Was Not
One limitation of most floss trials is that they recruit healthy adults rather than more complex populations. People with severe gingivitis, braces, or advanced periodontal disease are often excluded. Children and older adults are usually not part of these trials either.
This means the numbers reflect how the product performs in the average mouth, not in challenging clinical situations. That does not diminish the value of the data. It simply frames it correctly. Clinicians who treat a broad range of patients will want to interpret the results with this context in mind.
Where Transparency Can Improve
Smart Floss presents clear numerical claims on its site. That alone puts it ahead of many oral care products that rely on vague language. Still, transparency can always go further. Making the full clinical reports available in PDF would allow dentists and journalists to evaluate the raw scoring tables.
Readers could then see how plaque was measured, what scoring system was used, and whether the improvements were consistent across tooth surfaces. A plain language summary would also help. Most consumers do not know the difference between Loe and Silness scoring or why bleeding index matters. A visual chart showing before and after scores would make the numbers easier to digest.
Brands that publish full data often gain deeper trust. It signals confidence. It also opens the door for independent reviewers to validate the findings.
What Consumers Should Take Away
Most shoppers want simple guidance. They want to know whether a floss cleans better and whether it will help their gums bleed less. Percent improvements help, yet every percentage has a context. An increase in plaque removal does not guarantee perfect oral health. It simply improves the odds of keeping surfaces cleaner.
For consumers, the most practical interpretation is this. If two products cost roughly the same, and one has strong evidence that it removes more plaque, the data becomes a useful tie breaker. If a floss also improves gum bleeding scores, that gives it an added advantage for people who deal with inflammation. Smart Floss is positioned as a higher performing option, and the available numbers indicate that the product delivers on that positioning.