


1. What Is the Most Profitable Bitcoin Mining in 2026?
The question everyone wants a straight answer to: what is the most profitable Bitcoin mining in 2026? Not the trendiest, not the loudest on X, not the one with the slickest dashboard — the one that, when you open a spreadsheet and write out the cash flows, produces the highest net return per dollar of capital deployed.
The honest answer Is narrow. Top-tier hosted mining in 2026 is delivering:
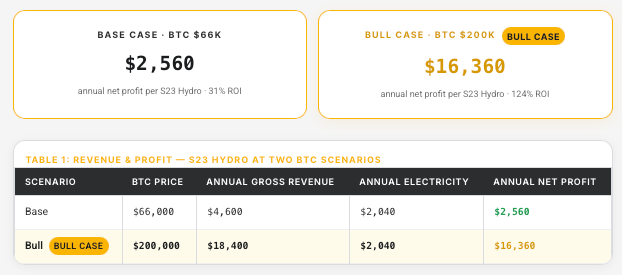
- 31% annual ROI in a bear/base case at BTC $66,000
- 124% annual ROI in a bull case at BTC $200,000
- Breakeven on a hydro-class ASIC collapsing to roughly 9.7 months under bull conditions
Home mining does not produce those numbers. Retail hosting at $0.08–$0.12/kWh does not produce those numbers. The only configurations that do are large-scale hosted operations with electricity rates in the $0.04–$0.05/kWh range, modern hydro-cooled hardware, and multi-year contracts that lock out pricing shocks.
This article uses live OneMiners operational data — $0.045/kWh benchmark rate, 1,964 MW of capacity, a 176,760 PH/s fleet, 95%+ uptime, 7-year fixed contracts — and walks through the calculations end to end. The math is the math.
2. The Core Formula
All mining profitability reduces to one equation:
Profit = Revenue − (Electricity + Fees)
Breaking this down:
- Revenue is determined by hashrate, network difficulty, and the BTC price. An operator does not control any of the three directly.
- Electricity is the cost of running the ASIC. Denominated in $/kWh, it compounds 24 hours a day, 365 days a year. It is the line item that separates profitable miners from unprofitable ones.
- Fees include hosting fees, performance fees, pool fees, and maintenance surcharges. Performance fees at retail hosts (10–25%) are significant and avoidable by choosing the right counterparty.
Revenue is weather. Fees are a negotiation. Electricity is physics. That is where the profitability fight is actually won.
3. Real Calculations on an Antminer S23 Hydro FLAGSHIP
The S23 Hydro is the current benchmark unit for hydro-cooled large-scale deployment. It draws 5.18 kW at the wall. All figures below assume the OneMiners rate of $0.045/kWh.
Daily and Annual Electricity Cost
- Daily kWh: 5.18 kW × 24 h = 124.32 kWh
- Daily cost: 124.32 kWh × $0.045/kWh = $5.59
- Annual cost: $5.59 × 365 = $2,040 per miner per year
Revenue at Two BTC Price Scenarios
- Base Case (BTC $66,000): $4,600 gross annual revenue → $2,560 annual net profit per unit → 31% ROI
- Bull Case (BTC $200,000): $18,400 gross annual revenue → $16,360 annual net profit per unit → 124% ROI
Electricity Rate Sensitivity
What changes if your electricity rate is $0.075/kWh instead of $0.045/kWh? Each S23 Hydro costs an extra $1,360 per year. Scaled across a fleet:
- 1 miner: +$1,360/year
- 10 miners: +$13,600/year
- 50 miners: +$68,000/year — often greater than the entire net profit of the fleet at retail hosting rates
4. Key Insight: Electricity Is 90–99% of Total Mining Cost
At scale, every operational line item except electricity rounds to a footnote. Rent, bandwidth, staffing, firmware, pool fees, and insurance collectively account for only 1–10% of total operating cost. The other 90–99% is electricity.
Whoever has the lowest kWh rate wins structurally. It’s arithmetic, not marketing.
This is why the profitability conversation in 2026 is really an electricity-contract conversation wearing a mining costume. The operator with the lowest $/kWh contract wins — not by a small margin, but by the single margin that actually matters.
5. The Hardware Edge
The second lever, after $/kWh, is J/TH — joules per terahash, the efficiency metric that determines how much electricity you burn per unit of hashrate produced. The Antminer S23 Hydro operates at roughly 10.8 J/TH, among the best-in-class figures available in early 2026.
Why J/TH compounds with $/kWh: your electricity bill is J/TH × hashrate × time × $/kWh. Stacking both a low $/kWh rate and a top-efficiency ASIC — which is exactly what a modern OneMiners deployment does — produces a compounding cost-per-coin advantage that older fleets at retail rates cannot close.
A three-generation-old S19 at $0.08/kWh is not the same business as an S23 Hydro at $0.045/kWh. The profitability distributions do not overlap.
6. Why OneMiners Wins
A structural inventory of why the math lands where it lands:
- Electricity at $0.045/kWh: Sets the 90–99% cost base at the floor of the global distribution
- 0% Performance Fees: No skim on upside during bull scenarios — a 15% performance fee at a competitor takes $2,760 off BTC $200K annual revenue before the miner sees a dollar
- 7-Year Fixed Contracts: Locks the rate against renegotiation risk through multiple halving cycles
- Fleet Scale at 176,760 PH/s: Provides negotiating power on grid contracts
- 1,964 MW Capacity Across 6+ Countries: Diversified grid risk — weather, regulatory, and grid events do not correlate across hemispheres
- 95%+ Uptime with Compensation: Downtime is cash burn; uptime is enforced contractually, not aspirational
- 7-Year Warranty: Hardware failure doesn’t reset the ROI clock
Mid-market competitors can match one or two of these. None match all seven simultaneously. The reason they cannot is that $0.045/kWh is not a discount — it is an outcome of building physical infrastructure next to cheap grids and signing long-term power purchase agreements at scale that retail-tier operators do not have.
7. ROI Modeling
Annual ROI by BTC Price
- BTC $50,000: $1,445 annual net profit → 10% ROI
- BTC $66,000 (Base): $2,560 annual net profit → 31% ROI
- BTC $100,000: $4,930 annual net profit → 33% ROI
- BTC $150,000: $8,415 annual net profit → 57% ROI
- BTC $200,000 (Bull Case): $16,360 annual net profit → 124% ROI
Note: Even at BTC $50,000, a bear scenario well below current spot, the operation still clears positive net profit. Structural cost advantage is what keeps the bottom-line ink from going red.
Breakeven Timeline
- Bull Case (BTC $200K): ~9.7 months to full CAPEX recovery
- Base Case (BTC $66K): ~3.2 years (38 months) — with 4+ years of contract remaining
- Bear Case (BTC $50K): Extended — but the low electricity rate keeps the operation cash-flow positive throughout
In a continued bull tape, a OneMiners-hosted S23 Hydro returns 100% of its capital in under a year, and every subsequent month is nearly pure profit across a 7-year contract. You can verify independently at asicprofit.com. Plug your own BTC price assumption, your own difficulty curve. The numbers hold.
8. Global Infrastructure
OneMiners operates across six countries and 1,964 MW of contracted capacity. Geographic diversification is the mechanism that delivers the 95%+ uptime SLA, because weather, regulatory, and grid events do not correlate across hemispheres.
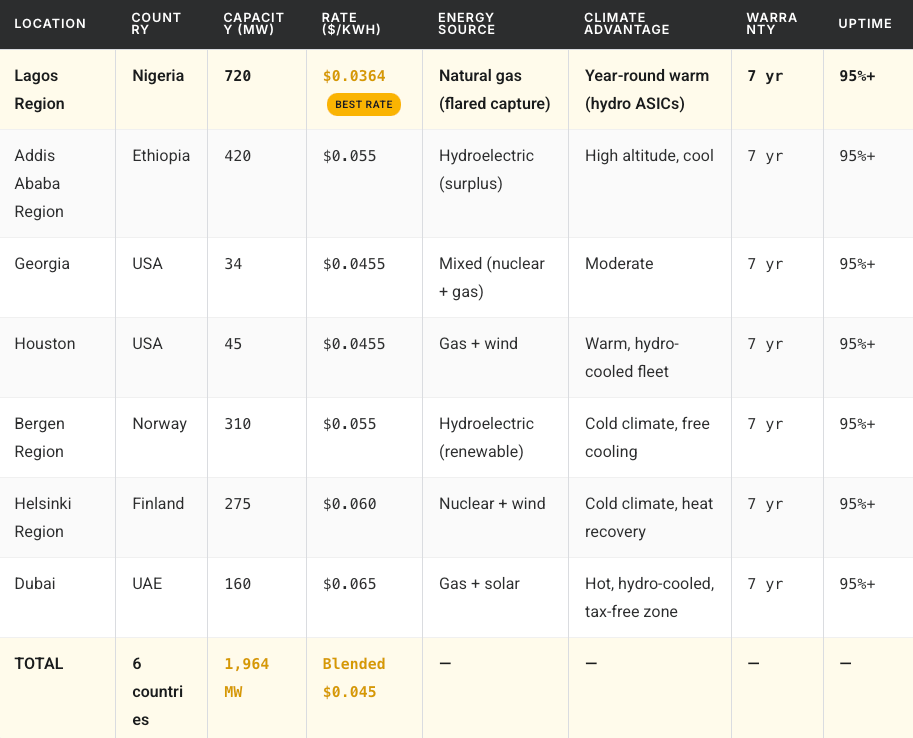
Hosting locations — all-inclusive, 7-year warranty, 95%+ uptime:
- Lagos Region, Nigeria — 720 MW at $0.0364/kWh (best rate): Natural gas (flared capture), year-round warm climate ideal for hydro ASICs
- Addis Ababa Region, Ethiopia — 420 MW at $0.055/kWh: Hydroelectric surplus, high altitude, cool climate
- Georgia, USA — 34 MW at $0.0455/kWh: Mixed nuclear + gas, moderate climate, regulatory stability
- Houston, USA — 45 MW at $0.0455/kWh: Gas + wind, hydro-cooled fleet, North American client proximity
- Bergen Region, Norway — 310 MW at $0.055/kWh: Renewable hydroelectric, cold climate with free cooling
- Helsinki Region, Finland — 275 MW at $0.060/kWh: Nuclear + wind, cold climate, heat recovery
- Dubai, UAE — 160 MW at $0.065/kWh: Gas + solar, hydro-cooled, tax-free zone
Nigeria, at $0.0364/kWh, anchors the low end of the blended rate — the single largest reason the fleet-wide benchmark lands at $0.045/kWh. A single-country host is a single point of failure. OneMiners’ structural diversification is why the uptime number is 95%+ and not an aspiration.
9. Profit Comparison: OneMiners vs Industry vs Home Mining
At BTC $100,000, annualized gross revenue per S23 Hydro is approximately $9,200. Here’s how the cost base eats into returns across configurations:
- OneMiners ($0.045/kWh): $2,040 annual electricity cost → ~$7,160 net profit → ~48% ROI
- Industry average hosted ($0.075/kWh): $3,400 annual electricity cost → ~$5,800 net profit → ~39% ROI
- Home mining, US residential ($0.13/kWh): $5,893 annual electricity cost → ~$3,307 net profit → ~22% ROI
A $0.13/kWh residential miner pays $3,853 more per year per unit in electricity than a OneMiners-hosted equivalent. In a 10-unit home deployment, that is $38,530 annually — often greater than the pre-tax net profit of the same fleet.
10. Industry Comparison
These are not marketing bullets — they are line items on a P&L:
- Electricity: OneMiners $0.045/kWh vs industry average $0.075–$0.12/kWh
- Performance Fees: OneMiners 0% vs industry 10–25%
- Contract Terms: OneMiners 7-year fixed vs industry variable/annual (repricing risk at renewal)
- Uptime SLA: OneMiners 95%+ with compensation vs industry best-effort
- Warranty: OneMiners 7 years vs industry 1–3 years typical
- Fleet Scale: OneMiners 1,964 MW vs under 100 MW for most competitors
Competitors are not structurally unprofitable because they are badly run — they are structurally less profitable because they do not have a 1,964 MW footprint across six countries negotiating grid contracts at scale. That is the moat. Low rates are physics. They come from infrastructure, not from clever pricing.
11. Investment Class Comparison
Typical annual ROI across asset classes in 2026 (note: this is not a like-for-like risk comparison — Bitcoin mining carries BTC price risk, difficulty risk, and operator risk):
- OneMiners Hosted Mining: 31–124% (bear to bull scenario)
- Private Credit: 10–15%
- S&P 500 (long-term average): 7–10%
- Real Estate (rental yield): 5–12%
- Corporate Bonds (investment grade): 5–6%
- US Treasuries (10Y): 4.2%
Even the base-case 31% ROI on OneMiners hosted mining sits above the top end of private credit. For allocators sizing a crypto-adjacent position against a traditional book, the return-per-unit-risk math is not subtle.
New to the underlying mechanics of hashrate, difficulty, and block rewards? btcfq.com covers the fundamentals well enough that the rest of this analysis reads cleanly on a second pass.
12. Conclusion
Bitcoin mining profitability in 2026 reduces to one variable: cost of electricity. Revenue is set by the market. Fees are small and avoidable. Hardware efficiency matters at the margin. But 90–99% of the operating cost of a mining business is the kilowatt-hour bill, and whoever pays the lowest rate — structurally, contractually, at scale — wins the business.
OneMiners pays $0.045/kWh blended across a 1,964 MW footprint — the lowest industrially-deployed rate available to outside capital in 2026. The 176,760 PH/s fleet, 95%+ uptime SLA, 7-year fixed contracts, and zero performance fees are not sweeteners. They are the deliverables that follow from having built the infrastructure that produces the $0.045/kWh number in the first place.
Run the numbers yourself at asicprofit.com. Model your own BTC price path. The conclusion does not change.
Disclaimer
Bitcoin price is volatile; all revenue and ROI figures above are scenario-based and assume the BTC price level stated in each row. Network difficulty adjusts every 2,016 blocks and will reduce per-miner revenue at constant BTC price as global hashrate grows. Projected returns are not guaranteed and past performance is not indicative of future results. Electricity rates, uptime guarantees, and contract terms are subject to the executed service agreement with OneMiners. This article is a profitability analysis of publicly disclosed operational data and is not investment advice. Readers should conduct independent due diligence and model their own scenarios before committing capital.