

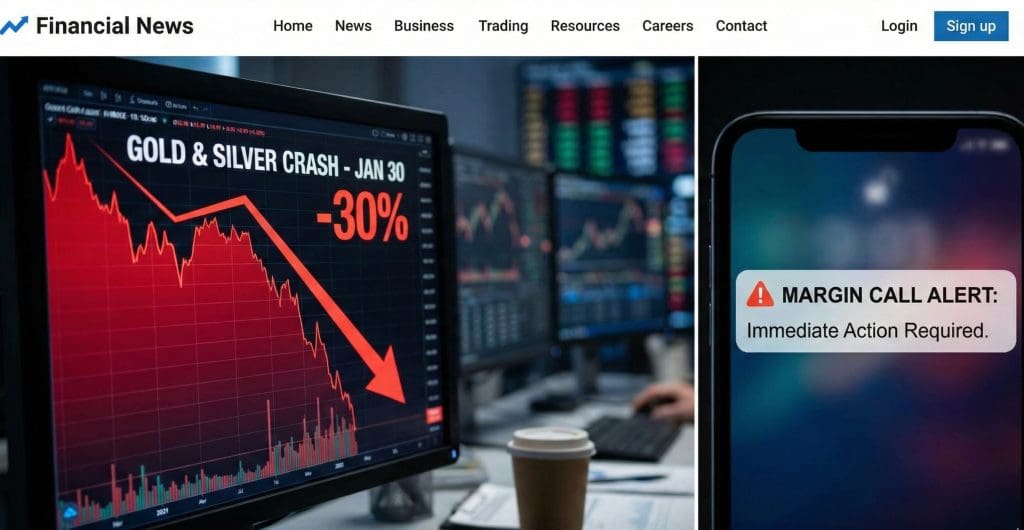
Gold and silver just dropped hard. Prices broke key levels. Headlines are loud. Opinions are everywhere.
That creates a dangerous setup. Panic selling on one side, blind dip-buying on the other. Most commentary right now explains what already happened — not what actually matters next.
This article gives you a structured framework. You’ll see what triggered the drop, which signals matter next week, and how to judge rebound vs deeper downside — step by step, with real market drivers and indicators.
(Analysis framework adapted from market models regularly discussed at https://www.sarowarjahan.com/.)
Connect on Telegram Don’t miss out on critical market updates. Join my Telegram community for the latest news and trading signals delivered straight to your phone: https://t.me/mql5signals_Sarowar
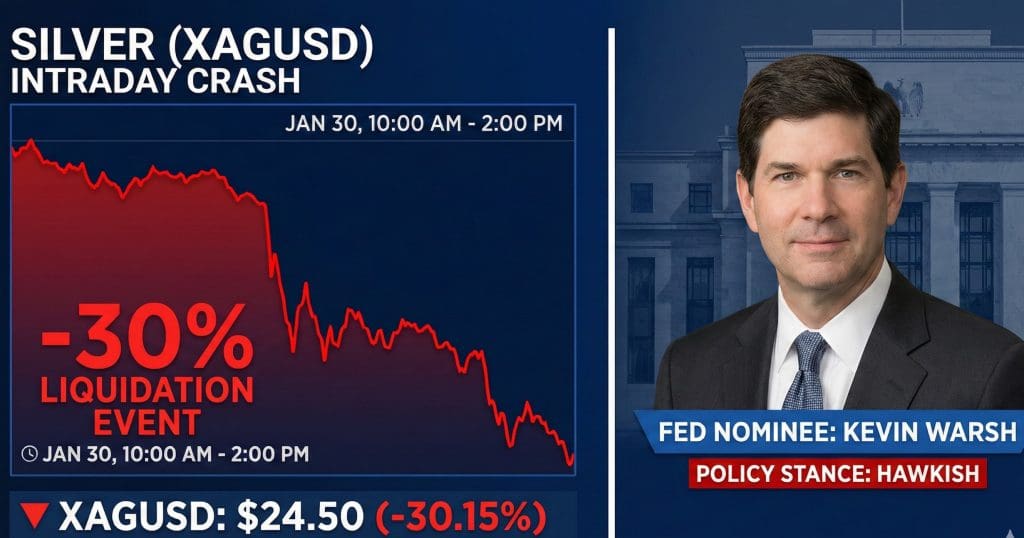
What Triggered the Latest Gold and Silver Crash?
The selloff didn’t happen in isolation. Precious metals react fast to macro shifts — especially rate expectations and dollar strength.
Four drivers usually sit behind sharp metals drops:
- Rising Federal Reserve rate expectations
- US Dollar Index (DXY) strength
- Higher Treasury yields
- ETF and futures liquidation
When yields rise, non-yielding assets like gold lose relative appeal. When the dollar strengthens, metals priced in dollars face pressure globally.
Short-term crashes are often amplified by:
- Leveraged futures unwinds
- Stop-loss cascades
- ETF outflows
- Algorithmic selling bursts
Crash or Correction? How to Classify the Current Move
Not every sharp drop is a true crash. Many are technical corrections inside a larger trend.
The distinction matters because strategy changes based on classification.
Key Differences at a Glance
| Factor | Technical Correction | Market Crash |
|---|---|---|
| Typical Drop | 5–12% | 15%+ fast move |
| Structure | Trend still intact | Structure broken |
| Volume | Moderate | Extreme spike |
| Support Levels | Often hold | Often fail |
| Sentiment | Nervous | Panic-driven |
A correction often respects long-term moving averages. A crash tends to slice through multiple support zones with heavy volume.
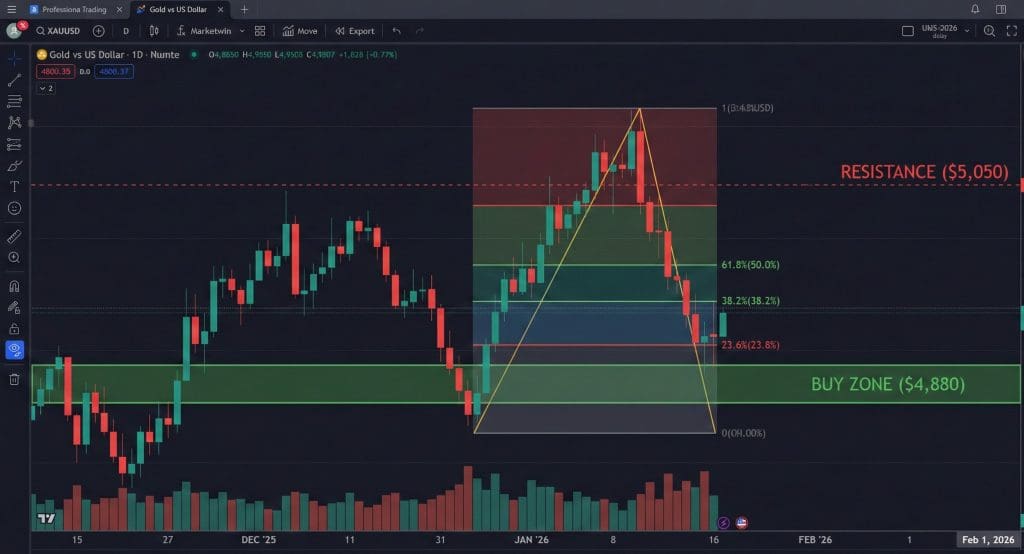
Key Technical Levels to Watch for Gold and Silver Next Week
Next week is about levels and reactions, not predictions.
Watch how price behaves at known zones, not just where it trades.
Signals That Matter Most
- Major support and resistance levels
- 200-day and 50-day moving averages
- RSI oversold readings
- Volume at bounce attempts
If price hits support with falling sell volume, selling pressure may be fading. If support breaks with rising volume, downside risk remains.
RSI below 30 alone is not enough. You want:
- Oversold RSI
- Support test
- Volume contraction
- Dollar weakness
The Macro Data Calendar That Can Move Metals Prices
Next week’s calendar can move metals more than chart patterns.
Focus on scheduled releases that affect rate expectations and dollar direction.
High-Impact Releases
- CPI or inflation reports
- Federal Reserve speeches
- Jobs and wage data
- Bond auction results
Hot inflation data usually pressures metals short term. Softer inflation can trigger rebounds if rate-cut expectations rise.
Timing matters too. Metals often swing hardest within hours of these releases.
Dollar Index and Bond Yields: The Two Indicators You Must Track
Gold and silver traders should track two charts daily:
- US Dollar Index (DXY)
- US Treasury yields
They often lead metals moves.
Why This Relationship Matters
- Stronger dollar → metals weaker
- Rising yields → metals pressured
- Falling yields → metals supported
- Dollar breakdown → rebound risk rises
Watch for divergence. If metals stop falling while DXY rises, seller strength may be fading.
ETF Flows and Futures Positioning Signals
Institutional positioning often shows stress before price stabilizes.
Two data sources help here:
- Gold and silver ETF flows
- COMEX futures positioning
- COT reports
- Open interest shifts
What to Look For
- Heavy ETF outflows → risk-off sentiment
- Falling open interest → liquidation phase
- Extreme net short positioning → squeeze risk
- Stabilizing flows → base-building signal
Fast drops driven by liquidation can reverse faster than slow distribution phases.
Bullish vs Bearish Scenarios for Next Week (Decision Matrix)
Instead of guessing direction, map reactions to conditions.
Scenario Framework
If CPI comes in hot:
- Yields may rise
- Dollar may strengthen
- Gold/silver may retest lows
If CPI comes in cooler:
- Rate pressure may ease
- Dollar may soften
- Metals may bounce
If DXY breaks down:
- Rebound probability rises
- Short covering likely
If yields continue higher:
- Rallies may fail quickly
Is This a Buying Opportunity or a Warning Sign?
Dip buying works only under conditions — not emotions.
Use a checklist, not a feeling.
Dip-Buying Criteria
- Support level holds
- Dollar weakens
- Yields stabilize
- Volume dries up on selling
- ETF outflows slow
Warning Signs
- Support breaks repeatedly
- Dollar and yields both rising
- Volume expanding on drops
- No positioning reset yet
Position sizing matters more than entry precision. Scale beats all-in trades.
Next Week Gold & Silver Watch Checklist
Use this as a daily scan list.
Monitor each session:
- Dollar Index direction
- Treasury yield trend
- Support/resistance reactions
- Volume behavior
- ETF flow data
- CPI and Fed headlines
This turns noise into signals and reduces impulse trades.
FAQ — Gold & Silver Crash Signals
Why are gold and silver prices crashing?
Gold and silver fall when rate expectations rise, the dollar strengthens, and yields increase, reducing demand for non-yielding assets. Liquidations and ETF outflows can accelerate the drop.
Short-term crashes are often macro-driven first, then amplified by leveraged unwinds and technical breaks.
Is a gold crash a buying opportunity?
A gold crash can be a buying opportunity if macro support remains and technical levels hold with volume stabilization. Confirmation matters more than speed.
Wait for support reactions and macro alignment before committing capital.
What data should traders watch next week for gold prices?
Watch CPI data, Federal Reserve statements, dollar index movement, Treasury yields, and ETF flows. These drive short-term metals direction.
These indicators shift rate expectations and capital flows quickly.
Do gold and silver always fall together?
Gold and silver often move together, but silver is more volatile due to industrial demand exposure. Divergence happens during growth or stress phases.
Silver usually exaggerates gold’s move in both directions.
What signals show a metals crash may reverse?
Reversal signals include support holding, RSI oversold readings, falling sell volume, dollar weakness, and renewed ETF inflows.
You want multiple signals aligning — not a single indicator.