
Statistics can feel like a foreign language. You hear terms like z-test, p-value, and standard deviation thrown around, and it’s easy to tune out. But here’s the thing: a z-test is just a way to answer a simple question. Is what I’m seeing real, or could it just be random chance?
Whether you’re comparing test scores, measuring product quality, or analyzing survey results, the z-test helps you make confident decisions based on data. It’s one of the most common statistical tests out there, and once you understand the basics, it’s not nearly as scary as it sounds.
In this guide, you’ll learn what a z-test is, when to use it, and how to interpret the results. We’ll walk through real examples that show the test in action. By the end, you’ll have a solid grasp of this powerful statistical tool.
What Is a Z-Test?
A z-test is a statistical method that helps you figure out if there’s a real difference between your sample data and a known population. It tells you whether your results are significant or just happened by chance.
Think of it this way. Let’s say you flip a coin 100 times and get 60 heads. That seems high, right? But is it high enough to prove the coin is unfair? Or could you just be lucky? A z-test answers that question.
The test works by comparing your sample mean to the population mean. It calculates how many standard deviations away your sample is from what you’d expect. That number is called the z-score.
If your z-score is high enough (usually above 1.96 or below -1.96), you can say your results are statistically significant. That means they’re probably not just random variation.
When Should You Use a Z-Test?
You can’t use a z-test for every situation. There are specific conditions where it works best.
Large sample sizes are the most important requirement. Your sample should have at least 30 observations. Why? Because the z-test assumes your data follows a normal distribution. With large samples, this assumption usually holds true thanks to something called the Central Limit Theorem.
Known population standard deviation is another key factor. You need to know the standard deviation of the entire population you’re testing against. In real life, this isn’t always available, which is why researchers often use t-tests instead.
Normally distributed data makes the z-test more accurate. If your data is heavily skewed or has weird patterns, other tests might work better.
Common scenarios where z-tests shine include:
- Quality control in manufacturing
- A/B testing in marketing
- Medical research with large patient populations
- Educational assessment comparisons
- Survey analysis with big sample sizes
Types of Z-Tests
There are two main flavors of z-tests, depending on what you’re trying to prove.
One-Sample Z-Test
This is the simplest version. You compare your sample mean to a known population mean.
For example, let’s say the average height of adult men in the US is 69 inches with a standard deviation of 3 inches. You measure 50 men in your gym and find their average height is 70.5 inches. Is your gym attracting taller guys, or is this just random variation?
A one-sample z-test gives you the answer.
Two-Sample Z-Test
This version compares the means of two different groups.
Imagine you’re testing two teaching methods. Group A gets traditional lectures, while Group B uses interactive learning. After a semester, you want to know if Group B performed better on the final exam.
You’d use a two-sample z-test to see if the difference in scores is statistically significant or just luck.
The Z-Test Formula
Don’t panic when you see the formula. It’s simpler than it looks.
For a one-sample z-test:
z = (x̄ – μ) / (σ / √n)
Let’s break that down:
- x̄ is your sample mean (the average of your data)
- μ is the population mean (the known average you’re comparing against)
- σ is the population standard deviation
- n is your sample size
- √n is the square root of your sample size
The formula calculates how many standard errors your sample mean is away from the population mean. The bigger that number, the less likely your results happened by chance.
Step-by-Step Example: One-Sample Z-Test
Let’s work through a real example to see how this plays out.
The Scenario
A coffee shop claims their large coffee contains 16 ounces. The company’s historical data shows a standard deviation of 0.5 ounces. You buy 36 large coffees and measure them. The average is 15.7 ounces.
Are they shortchanging customers, or is this normal variation?
The Calculation
We have all the numbers we need:
- Sample mean (x̄) = 15.7 ounces
- Population mean (μ) = 16 ounces
- Population standard deviation (σ) = 0.5 ounces
- Sample size (n) = 36
Plug them into the formula:
z = (15.7 – 16) / (0.5 / √36) z = -0.3 / (0.5 / 6) z = -0.3 / 0.083 z = -3.61
The Interpretation
Our z-score is -3.61. That’s pretty far from zero, which means our sample mean is quite different from the claimed 16 ounces.
Using a Z-test calculator, we find that a z-score of -3.61 corresponds to a p-value of about 0.0003. That’s way below the standard threshold of 0.05.
What does this mean? There’s only a 0.03% chance you’d see this result if the coffee shop was being honest about their portions. The coffees are probably undersized.
Understanding P-Values
The p-value is the most important number you get from a z-test. It tells you the probability that your results happened by random chance.
Lower p-values mean stronger evidence. If your p-value is below 0.05 (5%), most researchers consider that statistically significant. You can reject the idea that there’s no real difference.
Higher p-values suggest your results might just be luck. If your p-value is above 0.05, you don’t have enough evidence to claim a real effect.
The 0.05 cutoff isn’t magic. Some fields use 0.01 for stricter standards, while others might accept 0.10. It depends on how certain you need to be.
Step-by-Step Example: Two-Sample Z-Test
Now let’s look at comparing two groups.
The Scenario
A school wants to know if boys and girls score differently on a standardized test. They sample 50 boys and 50 girls.
Boys’ scores:
- Mean = 78
- Standard deviation = 10
Girls’ scores:
- Mean = 82
- Standard deviation = 12
Is the 4-point difference meaningful, or just random variation?
The Calculation
For two samples, the formula changes slightly:
z = (x̄₁ – x̄₂) / √(σ₁²/n₁ + σ₂²/n₂)
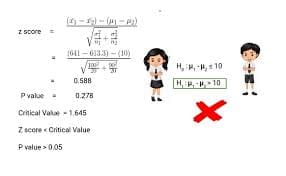
Plugging in our numbers:
z = (78 – 82) / √(10²/50 + 12²/50) z = -4 / √(100/50 + 144/50) z = -4 / √(2 + 2.88) z = -4 / √4.88 z = -4 / 2.21 z = -1.81
The Interpretation
Our z-score is -1.81. Looking this up, we get a p-value of about 0.07.
That’s above the 0.05 threshold. While girls scored 4 points higher on average, we can’t say with confidence that this represents a real difference. The gap might just be due to which students happened to end up in each sample.
If you needed to be sure, you’d need more data or a bigger sample size.
Z-Test vs. T-Test: What’s the Difference?
These two tests are cousins, but they’re not the same thing.
Use a z-test when:
- You have a large sample (30+ observations)
- You know the population standard deviation
- Your data is normally distributed
Use a t-test when:
- You have a small sample (less than 30)
- You don’t know the population standard deviation
- You’re estimating it from your sample
In practice, t-tests are more common because we rarely know the true population standard deviation. But when you do have that information and a big sample, the z-test is faster and simpler.
For large samples, the two tests give almost identical results anyway.
Common Mistakes to Avoid
Even pros mess up z-tests sometimes. Here are the pitfalls to watch out for.
Using small samples is the biggest error. If you have less than 30 observations, the z-test assumptions break down. Switch to a t-test instead.
Ignoring outliers can throw off your results. One extreme value can skew your sample mean and lead to wrong results. Always check your data for weird values first.
Misinterpreting p-values happens all the time. A p-value of 0.06 doesn’t mean your hypothesis is wrong. It just means you don’t have strong enough evidence to prove it right.
Assuming causation is another trap. A z-test can show two things are different, but it can’t prove one caused the other. That requires controlled experiments.
Not checking assumptions leads to invalid results. Make sure your data is roughly normal and you meet the other requirements before running the test.
Real-World Applications
Z-tests pop up everywhere once you start looking.
Manufacturing quality control uses z-tests constantly. A factory making bolts needs to ensure each batch meets size specifications. They sample random bolts and run z-tests to catch problems before shipping.
Healthcare research relies on z-tests for clinical trials. When testing a new drug, researchers compare patient outcomes between treatment and control groups. Z-tests help determine if the drug actually works.
Marketing and A/B testing uses z-tests to evaluate campaigns. You show half your audience one ad and half another. Which performs better? A z-test tells you if the difference in click rates is real.
Education assessment applies z-tests to compare student performance. Schools test whether a new curriculum improves scores or if different demographics perform differently on standardized tests.
Finance and economics leverages z-tests for market analysis. Analysts compare returns between investment strategies or test whether economic indicators differ across regions.
How to Perform a Z-Test
Ready to run your own z-test? Here’s the process.
Collect your data first. Make sure you have a random sample that’s representative of what you’re studying. Random selection matters more than you’d think.
Check your assumptions before calculating anything. Do you have 30+ observations? Is your data roughly normal? Do you know the population standard deviation?
Calculate the z-score using the formula we covered earlier. You can do this by hand, use a spreadsheet, or plug your numbers into statistical software.
Find the p-value from your z-score. Z-tables are available online, or you can use a calculator or software to convert your z-score to a p-value automatically.
Make your decision based on the p-value. If it’s below your threshold (usually 0.05), you’ve found a statistically significant result. If not, you don’t have enough evidence to claim a difference.
Report your results clearly. Include your sample size, z-score, p-value, and what they mean in plain English. Don’t just throw numbers at people without context.
Limitations of Z-Tests
Z-tests are powerful, but they’re not perfect.
They require specific conditions that don’t always exist in real data. The need for known population standard deviation limits when you can use them.
They assume independence between observations. If your data points influence each other, the test results become unreliable.
They’re sensitive to violations of the normality assumption with small samples. While large samples overcome this, you need to be careful with borderline cases.
They only test for differences, not the size of those differences. A result can be statistically significant but practically meaningless if the actual difference is tiny.
They don’t prove anything with 100% certainty. Statistical significance is about probability, not absolute truth.
Tips for Success
Want to get the most out of your z-tests? Keep these tips in mind.
Plan your sample size before collecting data. Bigger samples give you more power to detect real differences. Too small, and you might miss important findings.
Always visualize your data first. Create histograms or box plots to spot problems before running any tests. Your eyes can catch issues that formulas miss.
Use two-tailed tests unless you have a specific reason not to. One-tailed tests are only appropriate when you know in advance which direction matters.
Consider practical significance alongside statistical significance. A tiny difference might be statistically significant with a huge sample but not worth acting on.
Document everything so others can repeat your analysis. Write down your assumptions, calculations, and reasoning. Future you will thank present you.
Wrapping Up
The z-test is a straightforward way to determine if your data shows a real pattern or just random noise. It works great when you have large samples and known population parameters.
You calculate how far your sample mean is from the expected value, express that distance as a z-score, and use the p-value to decide if the difference matters. Simple concept, powerful tool.
Whether you’re in business, science, education, or any field that uses data, understanding z-tests helps you make smarter decisions. You’ll stop guessing and start knowing whether your observations mean something.
The math might look intimidating at first, but the logic is solid. You’re just asking: is this result unusual enough that something interesting is probably happening? With practice, z-tests become second nature.
Ready to run your first z-test? Start with small, clear examples and work your way up to more complex analyses. Every data-driven decision you make gets better when you understand the statistics behind it.