

Stock markets list thousands of publicly traded companies, listing approximately 9,000 in India and 4,000 in the US. A trader or investor cannot manually evaluate every stock to find the 5–10 they want to act on. A stock screener is a web or app-based analytics tool that filters this universe of stocks down to a relevant shortlist, using criteria based on technical analysis or fundamental analysis.
How Does a Stock Screener Work?
Stock screeners support two broad filtering approaches:
- Top-down approach
- Individual stock approach
Top-Down Approach
The top-down approach starts with identifying a strong-performing sector, then finds the best stocks within that sector. The process begins at the macro level (sector) and narrows down to individual stocks, hence the name “top-down.”
To identify a strong sector, you can use heatmaps or dashboards that show which sectors have the highest proportion of stocks displaying strength. Strength is typically measured by the percentage of stocks trading above their moving average, or the percentage of stocks near their 52-week high.
Individual Stock Approach
The individual stock approach filters all listed stocks directly, without starting from a sector. The method used depends on whether you are a trader or an investor:
1. Technical Analysis
Technical analysis is primarily used by traders. Traders identify stocks showing strong momentum, and sometimes trade specific chart patterns. A common starting point is monitoring Top Gainers, a ranked list of stocks that have delivered the highest single-day return on a given trading day.
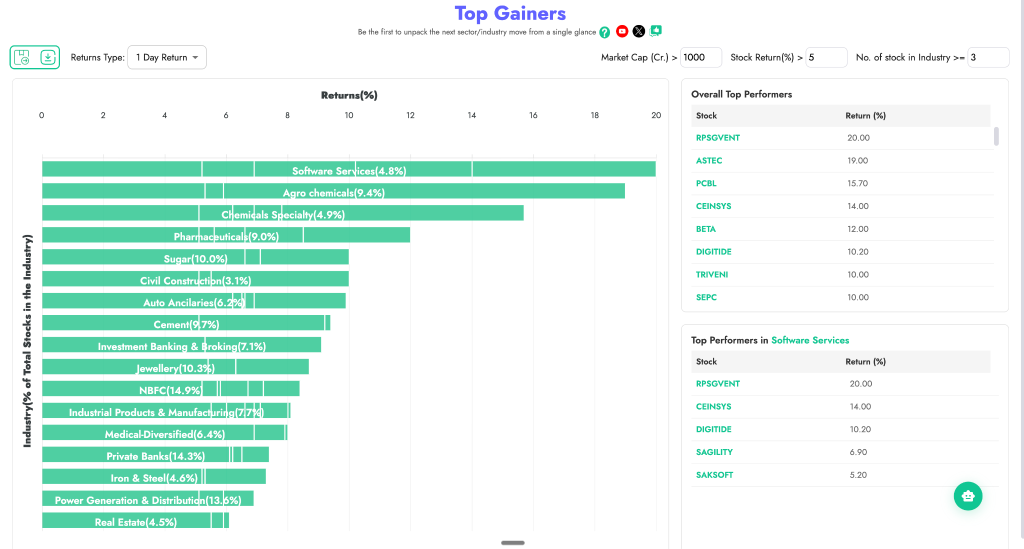
A deeper analysis includes filtering using technical criteria such as relative strength, Percentage from 52 week high, Volume criteria etc. This typically brings down the universe of scanning from a few thousands to a few hundreds, say 100- 200.
2. Fundamental Analysis
Fundamental analysis is primarily used by investors. As a starting point, investors use filter criteria such as Quarter on Quarter or Year on Year Sales Growth, P/E or PEG ratio for initial filtering.
For in-depth analysis, investors examine these filtered companies further using additional sources such as earnings call transcripts to build a detailed investment thesis before committing capital.
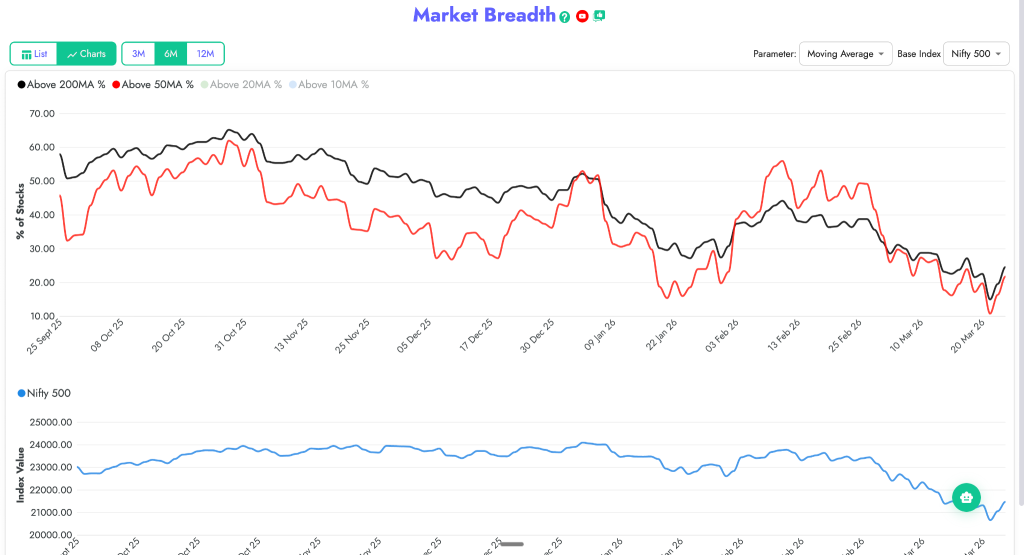
Situational Awareness: Market Breadth
All the stock selection work discussed so far assumes one critical condition: that the market environment is supportive of trading. This aspect is often overlooked, yet it plays a foundational role in determining whether a trade is worth taking. That is where market breadth comes in: it helps measure the overall health of the market, giving traders and investors a clearer picture of whether conditions favour participation or caution.
Market Breadth is one of the most underrated features in a stock screener. In a bull market, it is easy to dismiss market breadth because most positions work regardless. However, during choppy or declining market conditions, such as the 2018–19 phase in Indian markets or the 2025–26 phase, monitoring market breadth is essential for capital preservation.
Summary
A stock screener is an essential tool for any trader or investor navigating markets with thousands of listed stocks. It narrows a large universe down to a focused shortlist by applying filters rooted in either technical or fundamental analysis.
The two main filtering strategies, top-down (sector-first) and individual stock (criteria-first), suit different market participants and goals. Layering in market breadth as a situational awareness check adds a further edge, helping you avoid overexposure during choppy or declining market conditions. Used together, these approaches form a disciplined, repeatable stock selection process.