
If you’ve ever looked at your website analytics and wondered why your ad impressions are so much higher than your pageviews, you’re not alone. This confusion trips up countless publishers, bloggers, and website owners who are trying to understand their traffic and monetization metrics.
Here’s the thing: these two numbers will almost never match, and that’s completely normal. In fact, if they do match, you might be leaving money on the table.
Understanding the difference between ad impressions and pageviews isn’t just about satisfying your curiosity—it’s essential for optimizing your website revenue, making informed decisions about ad placement, and accurately measuring your site’s performance. Whether you’re just starting to monetize your blog or you’re a seasoned publisher looking to maximize your earnings, mastering these metrics is crucial.
In this guide, we’ll break down exactly what each metric means, why they differ, how they’re tracked, and most importantly, how you can optimize both to boost your bottom line. Let’s dive in.
What Are Pageviews? The Foundation of Traffic Measurement
A pageview (sometimes written as “page view”) is counted each time someone loads or reloads a webpage on your site. It’s one of the most fundamental web analytics metrics, representing a single instance of your page content being displayed to a visitor.
Think of it this way: when you visit your favorite news website and click on an article, that’s one pageview. If you refresh that same article, that’s another pageview. If you click to a different article on the same site, that’s a third pageview. Simple, right?
Types of Pageviews You Should Know
Not all pageviews are created equal, and most analytics platforms track several variations:
- Total Pageviews: Every single page load, including multiple views from the same person
- Unique Pageviews: Aggregated views within a single session, so multiple reloads only count once
- Virtual Pageviews: Custom tracking for single-page applications (SPAs) where traditional page loads don’t occur
Google Analytics 4, Adobe Analytics, and other web analytics platforms track pageviews as their primary metric for measuring site traffic and user engagement. This data helps you understand which content resonates with your audience, where traffic comes from, and how users navigate through your site.
What Are Ad Impressions? The Currency of Digital Advertising
An ad impression is counted each time an individual advertisement is loaded and displayed on your webpage. Notice the key difference? While pageviews measure page loads, ad impressions measure ad loads—and there’s usually more than one ad on each page.
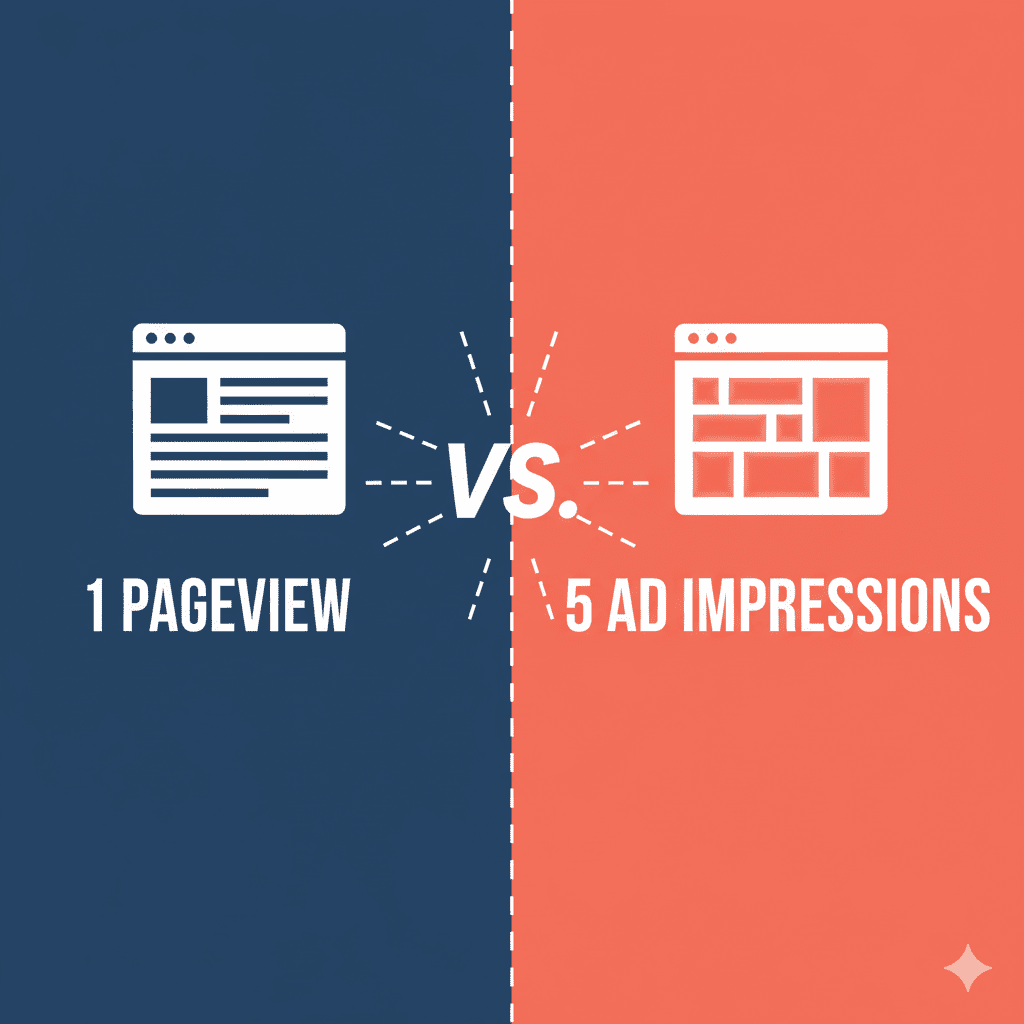
Here’s a practical example: Let’s say your blog post has five ad units strategically placed throughout:
- One header banner
- Two sidebar ads
- One in-content ad
- One footer ad
When someone visits that page (1 pageview), all five ads load and display (5 ad impressions). This is why your ad impression count will always be higher than your pageview count—sometimes significantly higher.
Served vs Viewable Impressions: A Critical Distinction
Not all impressions carry the same weight in the digital advertising world:
Served impressions are counted when an ad is delivered to the page, regardless of whether anyone actually sees it. If an ad loads at the bottom of a long article that most readers never scroll to, it still counts as a served impression.
Viewable impressions follow the IAB/MRC viewability standards: at least 50% of the ad’s pixels must be visible in the viewport for at least one continuous second. These are more valuable because they represent ads that users actually had a chance to see.
Many advertisers now pay based on viewable impressions rather than served impressions, which means optimizing for viewability directly impacts your revenue. This is where ad placement strategy becomes crucial—not just having ads on your page, but ensuring they’re positioned where users will actually see them.
The Key Differences: Side-by-Side Comparison
Let’s break down the fundamental differences:
AspectPageviewsAd ImpressionsWhat's CountedEach page loadEach ad loadTracking PlatformGoogle Analytics, web analyticsAd servers (GAM, AdSense)Primary PurposeMeasure traffic & engagementMeasure ad delivery & revenueWho Monitors ItContent teams, SEO specialistsMonetization teams, advertisersTypical Ratio13-6 per pageview
Understanding this relationship is essential: Ad Impressions = Pageviews × Ads per Page × Viewability Rate
If you have 10,000 monthly pageviews and 5 ad units per page with a 90% viewability rate, you can expect approximately 45,000 viewable ad impressions. This calculation forms the foundation of revenue forecasting for publishers.
Why Your Ad Impressions Are (Much) Higher Than Pageviews
The impression-to-pageview ratio varies widely, but typically ranges from 3:1 to 6:1. Here’s why:
1. Multiple Ad Units Per Page
This is the primary reason. Modern websites typically display 4-7 ads on a single page. News websites might have even more (8-12), while minimalist blogs might have fewer (2-3). Each ad unit generates its own impression.
2. Ad Refresh Mechanisms
Many publishers implement ad refresh, where ads automatically reload after a set time period (usually 30-60 seconds) if the user remains active on the page. Someone reading a 10-minute article might see the same ad slots refresh 3-4 times, multiplying impressions without any additional pageviews.
3. Lazy Loading and Scroll-Triggered Ads
With lazy loading, ads don’t load immediately when the page loads—they load as users scroll down. This improves page speed but can also create additional impression opportunities as users explore your content. Someone who scrolls through your entire article might trigger 2-3 additional ad loads that weren’t initially counted.
4. Single-Page Applications (SPAs)
If your site uses modern frameworks like React or Vue.js, content might load dynamically without traditional page refreshes. Users could navigate through multiple pieces of content (generating multiple pageviews in traditional tracking) while new ads continue to load and generate impressions.
How These Metrics Are Actually Tracked
Understanding the tracking mechanics helps you troubleshoot discrepancies and optimize both metrics effectively.
Pageview Tracking
When someone visits your site, a JavaScript tracking code (usually Google Analytics 4) fires and sends data to your analytics platform. This includes:
- The page URL
- Timestamp
- User information (anonymized)
- Traffic source
- Device and browser details
This tracking is relatively straightforward, though ad blockers can prevent 25-30% of pageviews from being counted. Privacy-focused browsers and cookie restrictions also impact accuracy.
Ad Impression Tracking
Ad impression tracking is more complex because it involves your ad server (like Google Ad Manager or AdSense). When an ad loads, it sends an impression beacon—a tiny piece of code that communicates back to the ad server saying “this ad was delivered.”
For programmatic ads, this gets even more intricate, involving:
- Real-time bidding exchanges
- Header bidding wrappers
- Multiple demand partners
- Viewability measurement scripts
- Fraud detection systems
This complexity is why ad impression counts can vary significantly across different platforms, and why a 5-10% discrepancy between ad server reports and analytics platforms is considered normal.
Which Metric Should You Focus On?
The truth? You need both, but for different reasons.
Focus on Pageviews When:
- Evaluating content performance and engagement
- Measuring SEO success and organic traffic growth
- Understanding user behavior and navigation patterns
- Setting editorial and content strategy
- Reporting to stakeholders about site reach
Pageviews tell you if people are finding and consuming your content. High pageviews with low engagement (short session duration, high bounce rate) might indicate clickbait or poor content quality.
Focus on Ad Impressions When:
- Calculating actual and potential revenue
- Optimizing ad placement and density
- Negotiating with ad networks or direct advertisers
- Testing different monetization strategies
- Analyzing CPM rates and fill rates
Ad impressions tell you how effectively you’re monetizing your traffic. You could have modest pageview numbers but excellent revenue if your impression-to-pageview ratio and CPM rates are strong.
The most successful publishers monitor both metrics together, understanding that great content drives pageviews, while smart monetization maximizes impressions and revenue per pageview.
How to Optimize Both Metrics for Maximum Revenue
Increasing Pageviews: Content and Engagement Strategies
- Create Comprehensive, High-Quality Content: Long-form articles (1,500+ words) tend to rank better in search engines and keep users engaged longer
- Internal Linking: Guide readers to related content with contextual links throughout your articles
- Related Post Recommendations: Use widgets to suggest 3-5 related articles at the end of each post
- Improve Site Speed: Fast-loading pages reduce bounce rates and encourage exploration
- Mobile Optimization: Over 60% of web traffic comes from mobile devices—ensure your site performs well on smartphones
Increasing Ad Impressions: Strategic Monetization
- Optimize Ad Placement: Position ads where users naturally look—above the fold, within content, and in the sidebar
- Add Strategic Ad Units: Increase from 3-4 to 5-7 ads per page without overwhelming users
- Implement Smart Ad Refresh: Reload ads for engaged users after 30-60 seconds (check your ad network’s policies)
- Use Sticky Ads: Header or sidebar ads that remain visible as users scroll
- Improve Viewability: Ensure ads load quickly and appear in visible locations
- Lazy Loading: Load ads as users scroll to improve initial page speed while maintaining impression opportunities
The golden rule: Never sacrifice user experience for short-term impression gains. Excessive ads lead to higher bounce rates, which ultimately reduces both pageviews and total impressions over time.
Understanding Revenue Metrics: CPM, RPM, and ECPM
Three card-style graphics showing formulas:
- Card 1: “CPM = (Revenue ÷ Impressions) × 1,000”
- Card 2: “RPM = (Revenue ÷ Pageviews) × 1,000”
- Card 3: “ECPM = Blended average of all CPMs”
To truly understand your site’s financial performance, you need to connect impressions and pageviews to actual revenue:
CPM (Cost Per Mille) is what advertisers pay per 1,000 ad impressions. If an advertiser pays $5 CPM and you deliver 100,000 impressions, you earn $500. CPM rates vary dramatically by niche, seasonality, and audience quality—anywhere from $0.50 to $50+ for premium audiences.
RPM (Revenue Per Mille) measures revenue per 1,000 pageviews, giving you a clearer picture of how much you’re earning from your traffic. If you earned $500 from 10,000 pageviews, your RPM is $50. This metric combines your impression-to-pageview ratio with your CPM rates.
ECPM (Effective CPM) averages your revenue across all ad types and networks, providing a single number for comparison. This is especially useful if you’re running multiple ad networks or a mix of CPM, CPC, and programmatic ads.
Example calculation:
- 20,000 monthly pageviews
- 5 ads per page = 100,000 impressions
- Average CPM of $4
- Revenue = (100,000 ÷ 1,000) × $4 = $400
- RPM = ($400 ÷ 20,000) × 1,000 = $20
Understanding these metrics helps you set realistic revenue goals and identify optimization opportunities.
Common Tracking Issues and How to Fix Them
Discrepancies between pageviews and expected impressions are common. Here’s what to look for:
When Impression-to-Pageview Ratio Is Too Low (Below 2:1)
Possible causes:
- Too few ad units on the page
- Ads not loading properly due to technical issues
- High ad blocker usage (can’t be fixed)
- Slow page speed preventing ads from loading before users leave
- Lazy load configuration issues
Solutions: Test ad loading in different browsers, check your ad code implementation, and use Google Chrome DevTools to identify loading errors.
When Impression-to-Pageview Ratio Is Too High (Above 8:1)
Possible causes:
- Overly aggressive ad refresh settings
- Too many ad units harming user experience
- Counting errors or duplicate tracking codes
- Bot traffic inflating impression counts
Solutions: Review your ad density and refresh settings, implement bot detection, and audit your ad tags for duplicates.
Platform Discrepancies
Don’t panic if Google Analytics shows 10,000 pageviews while your ad server reports 9,200 impressions. A variance of 5-15% is normal due to:
- Ad blockers affecting one platform more than another
- Different tracking methodologies
- Time zone differences in reporting
- Bot filtering differences
Conclusion: Master Both Metrics for Sustainable Success
Understanding the difference between ad impressions and pageviews isn’t just academic—it’s the foundation of effective website monetization. Pageviews measure your reach and content performance, while ad impressions determine your revenue potential. Together, they tell the complete story of your website’s health and profitability.
The most successful publishers don’t choose between these metrics; they optimize both strategically. Create compelling content that drives pageviews, then monetize that traffic intelligently to maximize impressions and revenue per visitor.
Start by auditing your current numbers:
- What’s your impression-to-pageview ratio?
- How does your RPM compare to industry benchmarks?
- Are there quick wins in ad placement or content optimization?
Remember: sustainable revenue growth comes from the balance between great content that people want to read and smart monetization that doesn’t drive them away. Master both sides of this equation, and you’ll build a thriving, profitable website.
Frequently Asked Questions (FAQs)
What is the typical impression-to-pageview ratio for a blog?
Most blogs and content websites achieve an impression-to-pageview ratio between 3:1 and 6:1. This means if you have 10,000 monthly pageviews, you should expect 30,000 to 60,000 ad impressions. The exact ratio depends on how many ad units you have per page, your ad refresh settings, and your content length (longer articles with more scroll depth typically generate more impressions). News websites often see higher ratios (6-8:1) due to more aggressive ad placement, while minimalist lifestyle blogs might have lower ratios (2-4:1). If your ratio falls outside this range, it might indicate either an optimization opportunity or a tracking issue that needs investigation.
Can I increase ad impressions without hurting my pageviews?
Yes, absolutely! The key is strategic optimization rather than simply adding more ads everywhere. Focus on: (1) Improving ad viewability by placing ads where users naturally look rather than hiding them below the fold, (2) Implementing smart ad refresh that reloads ads for engaged users after 30-60 seconds, (3) Using sticky/anchor ads that remain visible during scrolling, (4) Optimizing page layout to encourage deeper scrolling and longer session times, and (5) Ensuring fast page load speeds so users don’t bounce before ads load. The critical balance is maintaining excellent user experience—if visitors find your site too cluttered or slow, they’ll leave quickly, ultimately reducing both pageviews and total impressions over time. Test changes incrementally and monitor your bounce rate and session duration.
Why are my ad impressions much lower than expected?
If you’re seeing significantly fewer ad impressions than your pageview count suggests, several factors might be at play. Ad blockers are the most common culprit, with 25-30% of web users employing them—these completely prevent ads from loading and being counted. Technical issues like improperly implemented ad codes, JavaScript errors, or slow loading times can prevent ads from displaying. Low fill rates mean your ad network can’t fill all available ad slots with paying advertisers (common in certain niches or geographic regions). Aggressive bot filtering by your ad network might be removing invalid traffic that Google Analytics still counts as pageviews. To troubleshoot, check your ad implementation using browser developer tools, review your ad network’s fill rate reports, and compare metrics across multiple platforms to identify patterns.
Do pageviews or ad impressions matter more for making money?
While both metrics are important, ad impressions have a more direct relationship to revenue since most ad networks pay based on CPM (cost per thousand impressions). Your actual earnings formula is: Revenue = (Ad Impressions ÷ 1,000) × CPM. However, you can’t generate impressions without pageviews, so they work together in your monetization strategy. A more useful metric for publishers is RPM (Revenue Per Mille pageviews), which shows how much you earn per 1,000 pageviews and naturally accounts for your impression-to-pageview ratio. For example, 10,000 pageviews generating 50,000 impressions at $4 CPM equals $200 revenue, or $20 RPM. Focus on creating quality content that drives pageviews, then optimize your monetization strategy to maximize impressions and CPM rates. The highest-earning publishers excel at both.
How do I track both pageviews and ad impressions together?
Pageviews and ad impressions are tracked by different platforms, so you’ll need to combine data from multiple sources. Google Analytics 4 or similar platforms track pageviews natively with comprehensive traffic analysis. Your ad server (Google Ad Manager, AdSense, Mediavine, AdThrive, etc.) tracks ad impressions with detailed monetization metrics. To view both together, you can: (1) Export and combine data in spreadsheets, calculating your impression-to-pageview ratio and RPM manually, (2) Use Google Data Studio/Looker Studio to create unified dashboards pulling from both GA4 and your ad server, (3) Implement custom tracking to send ad impression events to Google Analytics (requires technical setup), or (4) Use enterprise analytics solutions like Google Analytics 360 with BigQuery integration. Most publishers maintain separate dashboards and review them together during weekly or monthly performance reviews to spot trends and optimization opportunities.